The VIX Is Old but Not Dead – Here’s the Best Way to Play It Now
By Shah Gilani, Chief Investment Strategist, Money Map Report
Everyone thinks they know the CBOE Volatility Index – also known as the VIX… also known as the fear index. For decades, it has been widely used by investors of all stripes to make tactical decisions on how to trade the stock market. Most investors understand the VIX enough to derive some utility from it – or even better, play it by trading options or futures on the VIX itself.
But in the past couple of years – and in 2022 especially – the VIX has been “out of whack” with what the market is doing. I’m sure you remember last year – where we saw a seemingly endless stream of whiplash-inducing market reversals… but a close study of the VIX throughout that time frame shows a much more stable range of fluctuations than you would expect given how volatile the market was.
The discrepancies are bad enough that a lot of people are now saying the VIX is broken and no longer makes any sense.
Well, I’m here to tell you that isn’t true. There’s nothing wrong with the VIX – it’s just aged and is slower to react… a lot slower. What most people don’t understand is how the emergence of new trading products has changed the VIX – and in fact, the entire stock market.
Of course… when change happens, it means you have to learn new tricks to find the best opportunities for profit. And as always – here at Money Map Report – we have a plan to adapt to the “new normal” of the market in order to ensure we keep bringing in long-term returns.
This Is What the VIX Actually Measures
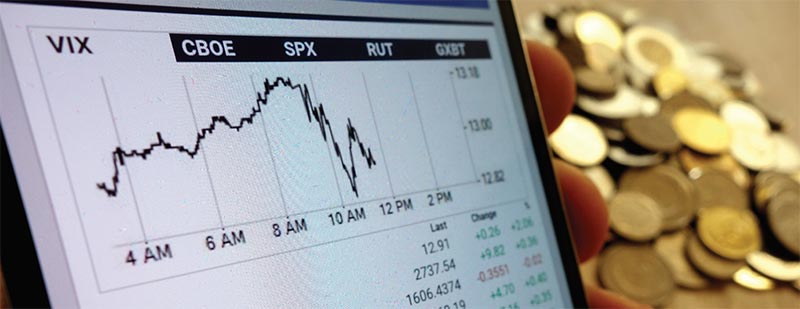
The Volatility Index – or VIX, which I did groundbreaking work on back when I was trading OEX options – according to the CBOE, “measures the level of expected volatility of the S&P 500 Index over the next 30 days that is implied in the bid/ask quotations of SPX options.”
“Thus, the VIX is a forward-looking measure, in contrast to realized (or actual) volatility, which measures the variability of historical (or known) prices.”
The origins of the VIX began with traders like me trying to make money.
Everyone knows the S&P 500 (SPX) is a market capitalization-weighted index of 500 big-cap stocks that professionals and institutions refer to as “the stock market.”
And everyone knows there are options on the S&P 500. Options trading on the S&P began in 1983 – only they weren’t options on the S&P 500… they were options on the S&P 100.
I know because I was a market maker on the floor of the Chicago Board of Options Exchange – in the brand-new S&P 100 (OEX) pit the day they launched.
When trading in OEX options began, we had no historical precedent by which we’d be able to “price” options on an index because it had never been done before.
Most of us in the pit relied on our Monchik-Weber computers that our clerks were running “upstairs,” since they weren’t allowed on the floor at that time. Monchik-Webers were programmed with the Black-Scholes options pricing formula and spit out theoretical prices that options should be worth based on the formula.
The problem was the prices our computers spit out had nothing to do with what options were trading for in the pits.
To make a long story short, a few of us got together to try and figure out what caused those pricing discrepancies and how to make money if we could figure out better theoretical prices to gauge against the prices we’d make as market makers trading all those options. The one piece of the formula that I thought was problematic was the historical volatility input – it was based on a look-back period. After playing with different look-back periods – including using multiple time frames – we hit on it.
Instead of inputting a historical volatility number, we’d try and extract from the prices being paid for options what “implied volatility” was inherent in actual premiums paid. That’s where implied volatility came from. And it’s implied volatility that the VIX measures.
By looking at actual options prices paid on puts and calls on the SPX that expire between 23 and 37 days in the future, the VIX math extracts what that implied volatility says traders expect in terms of movement of the SPX in 30 days from now.
The fear comes from a high VIX. If the VIX is 40: It implies that in 30 days, the S&P 500 could move 40%. That’s scary if it’s to the downside – hence the fear index.
The long-run mean for the VIX since 1990 is 19.7, but everyone rounds that up to 20.
All last year – when stocks were all over the place and we were in an ugly bear market – the highest the VIX got was 36.45. The average over 2022 was 25.64, according to macrotrends. That’s not high considering how volatile the market was.
So far – and we’re only one month into 2023 – the VIX high has been 22.9. It averaged just 20.1.
On Wednesday, February 1, 2023 – after the Fed announced a 25-basis point hike and the market roared higher – the VIX dropped from 20.04 to an intraday low of 17.52; way below its historical norm…
So what gives?
Well, to understand why the VIX is different now and what’s changed in the market… we have to talk about the new products that are available to trade these days since they are the catalysts of change.
How the Rise of Short-Dated Options Trading Changed Everything
So as I said above, this all started with the availability of options on the S&P 100 – or OEX – as trading instruments.
Options expirations started on a standardized quarterly basis, then went to a monthly basis. In 2005, the CBOE introduced weekly expiring options on the S&P 500 to amplify trading frequency, which the Exchange and product pushers justified as adding liquidity. Weekly options expired only on Fridays.
Then Monday and Wednesday expirations were added. And because progress is forever – on April 18, 2022, Tuesday expirations were added. Last but not least – on May 11, 2022 – Thursday expirations were added.
Now there are index options on the S&P 500 expiring every day. They’re weekly options – not daily options – but because they launch every day of the week (with a week to expiration), you can buy or sell an option with less than 24 hours to expiration. Those are called 0DTE options, as in “zero days to expiration.”
And it’s not just SPX index options that have 0DTE options available. Besides other index products, any stock or ETF that has lots of options cycle expirations can have 0DTE options available to trade.
While trading in 0DTE or 48-hours-expiration (two days) options wasn’t that popular at first, they’ve since exploded.
In the third quarter of 2022, 0DTE options volume was 44% of all SPX options trading volume – more than twice what it was six months earlier, according to Goldman Sachs data.
In the fourth quarter of 2022 – in just under 50% of trading days – 0DTE and 2DTE options volume was between 40% and 60% of all options volume.
And if you think it’s just institutional players and big-boy traders playing in the 0DTE ballpark, you’d be wrong. JPMorgan Chase says 13% of all “retail-involved options transactions” are now on 0DTE options.
So what’s all that got to do with the VIX? A lot.
One reason the VIX has been relatively low in what would normally be considered a very volatile market is that so many money managers are on the sidelines. With literally trillions of dollars sitting in cash and out of the market during the bear market, there just hasn’t been the need to buy put options as a hedge against long positions. Without panicked buyers of puts bidding up prices and the VIX, it’s been able to stay well below fear index levels.
But that’s not the principal reason the VIX looks out of whack. The real reason is 0DTE options are where traders are going – and not into 30-days-out expiration options, which are what the VIX measures.
0DTE options are a lot cheaper to buy than options expiring in 30 days or longer, and they command a significantly higher premium for the time you have to see your trade work out.
So buying 0DTE put options and rolling them over and over if you still want to bet on a downside move takes away from all the volume on 30-days-to-expiration SPX options, which are what the VIX reflects.
The same’s true for call options. Now, if you want to catch a quick and dramatic move to the upside and lots of sidelined players are worried about missing a “melt-up…” they’re buying 0DTW and 2DTE call options on everything from the SPX to Tesla.
So again: There’s nothing wrong with the VIX. It will still react – just more slowly than we were previously used to. And that makes it a good vehicle to trade – both to the upside and now even more so to the downside.
Our New Strategy for the VIX
The first thing we’ll do is pretty simple. We’ll be playing the VIX both ways starting today – using options spreads.
The other – far more impactful – experience we’ll feel over and over from short-expiration options trading is big market moves to the upside, to the downside, and dramatic reversals intraday over and over again… all thanks to the new options realities.
I’ve written before about those new realities. Market makers who sell all those short-dated options have increasing exposure as they end up overly exposed to rising gamma (They’re short gamma.) – which is the rate of change of deltas – and end up either chasing a move or trying to reverse it. It’s crazy stuff, but it’s the new normal. We’ll be playing that game too. Here’s how we’re going to get started.
Recommendation #1: CBOE Volatility Index
As I said, the VIX is merely sleeping – not broken or dead. Because of the short-term trading in 0DTE and 2DTE and the fact that so much institutional money is on the sidelines – the very money that would use the VIX to hedge – I see a trade directly on the VIX itself.
The institutional money I just mentioned is eventually going to come back into the markets, and they (the institutional investors and traders) will buy put options a month out to hedge their portfolios.
All it would take for the VIX to move is for people to start buying longer-dated put options as protection and the VIX will pop – just like a meme stock.
Action to Take:
- Buy-to-open VIX May 17, 2023 $24/$25 Call Spread for $0.30 or less. Plan on capturing a profit at 150%.
Recommendation #2: Big Lots Inc. (BIG)
Next up, I want to target an individual company that could pop up based on the same short-term trading mentality that affects the VIX.
Founded in 1967 and headquartered in Columbus, Ohio, Big Lots Inc. (BIG) operates as a home discount retailer in the United States. As of January 29, 2022, it operated 1,431 stores in 47 states and an e-commerce platform.
If we do move into a recession, consumers will turn toward discount retailers like Big Lots – and that would be great for the stock and its financials… which frankly, don’t look good. But this isn’t a recommendation based on great numbers. Rather, it’s a recommendation based on a company merely doing better than it has over the last year.
At this point, any good news should cause short traders to cover the positions and the stock could see a big run in no time.
Speaking of short traders, they’ve done a number on shares of BIG. The stock was trading as high as $73.23 on June 9, 2021 – but it recently traded as low as $12.87 on December 19, 2022.
Since then, though, the stock has gained 35.97% and it’s trading at $17.50 as I write this. That’s a big move, but it’s still 76.1% below its 2021 high. That leaves a lot of open air above the stock in the event the company can deliver any encouraging news in the first week of March 2023 – when it reports Q4 2022 results.
Currently, the percent short of float is a whopping 51.95%. Any good news is going to cause those shorts to cover, and we could be off to the races higher.
Additionally, consider that the entire float is only 28 million shares. It wouldn’t take much volume to get shares of BIG to move up.
Action to Take:
- Buy-to-open Big Lots Inc. (BIG) at market and use a 25% trailing stop. Hold your BIG shares in the Rocket Riders portion of your portfolio.
- If you want a more speculative version of the BIG recommendation, buy-to-open BIG March 17, 2023 $20/$22.50 Call Spread for $0.55 or less. Exit the position for a 150% profit or if shares of BIG trade down to $13.
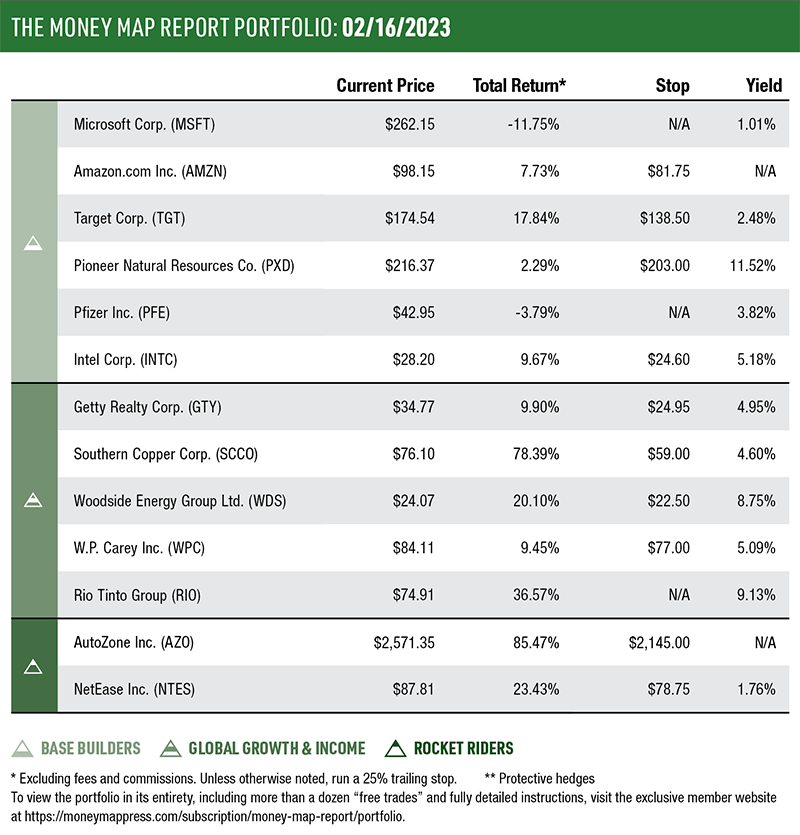
Portfolio Review
Markets & Commodities 1/17/23 to 2/16/23
| S&P 500 2.49% | Oil (WTI Crude) -3.27% |
| Dow 0.63% | Gold -3.42% |
Amazon.com Inc. (AMZN)
Despite some challenges last year, the e-commerce giant remains a top-flight growth stock for investors to look at for the foreseeable future. In Q3 of 2022, year-over-year operating income declined 48% – largely due to inflationary impact on infrastructural costs like energy and freight. But with their continuing market share gains in their cloud computing and web services divisions and a multiyear plan in motion to raise margins in all of their business arenas, this is going to be a stock that institutional and retail investors alike return to again and again.
And if the tale of the tape in 2023 is to be believed, they’re already beginning to flood back in. Since the beginning of the year, the stock is up approximately 15% at time of writing – and with inflationary pressures easing, the subsequent decrease in spending should bring cash flow levels more in line with what analysts want to see. We expect this will continue to provide solid returns for us in 2023 and beyond.
Return since Recommendation: 7.73% | Yield: N/A
Pioneer Natural Resources Co. (PXD)
While it’s true that green energy and renewables are growing, oil and gas aren’t going away anytime soon. PXD has an enormous amount of acreage in the southwestern United States, which it uses for hydrocarbon exploration. As the aftershocks of the Russian invasion of Ukraine continue to endanger oil and natural gas supply chains around the world and the U.S. seeks to reduce its dependency on foreign sources, PXD is poised to take advantage of demand.
In fact, their balance sheet is already reflecting this. We’re talking about 22% trailing 12-month revenue growth, 90% earnings growth, and a huge 11.36% dividend for shareholders at time of writing. Since we introduced this stock into the portfolio last August, we’ve enjoyed collecting that dividend while the stock appreciates.
Return since Recommendation: 2.29% | Yield: 11.52%
Target Corp. (TGT)
Q3 and Q4 2022 saw a large amount of interest in this retail corporation from institutional investors whose high-volume moves have increased the percentage of shares owned by institutions and hedge funds to 78.86% of total stock. When finance industry players like Vanguard Group, State Street Corp., and Truist Financial Corp. are piling into a stock, they aren’t looking for day-trading returns – these are long-term holds. And with earnings expected to increase by 57% in the next few years, there’s a good reason to be optimistic.
Target has increased its dividends for literally the past 55 years, making them one of the most reliable choices for income investors. They boast a five-year dividend growth rate of 10.5% and a current yield of 2.54% at time of writing. While dividend growth is likely to slow compared to the past two years and the likelihood of a weak earnings report at the end of this month could cause the stock price to tumble a bit, share buybacks and the diversification of revenue streams should create headwinds for the stock price going forward as cash flow improves.
Return since Recommendation: 17.84% | Yield: 2.48%
Ask Shah: Recession Chances and Alternative Stock Indices
Q: Janet Yellen recently said: ‘You don’t have a recession when you have 500,000 jobs and the lowest unemployment rate in more than 50 years.’ Do you think the odds of a recession have increased or decreased? – D. Meisner
A: Yellen is right. The odds of a recession are the same – whatever they are mathematically – and I’m guessing that’s 50/50. What’s changed is when a recession’s expected… if one comes. That likelihood is now out in the second half of this year or maybe 2024, according to some analysts. Given the strength of the economy – as measured by the labor market, jobs, unemployment, and rising wages – I’d say the chance of a recession is more like 60%, giving the edge to, “Yes, there will likely be one.” The real issue is: How stubborn is inflation? If it’s as stubborn as I think it is, the Fed’s going to have to raise rates more than expected – maybe to 6% on fed funds – and keep them there for a lot longer than anyone is guessing. That protracted run of elevated rates will eventually result in a recession.
Q: Is there an index of stocks we should be following and trading right now other than the main three (Dow, Nasdaq, S&P 500), and if so, what are they and why should we be paying attention to them?” – T. Kahrs
A: No, there isn’t another must-watch index – though the Russel 2000 (RUT) or the IWM ETF (for following small-cap domestic companies) is worth a look now and then. You include the Nasdaq, so just remember that there are two principal Nasdaq indices to watch: the Nasdaq Composite (sometimes IXIC, sometimes COMP, sometimes just Nasdaq) – which comprises all stocks listed on Nasdaq (Nasdaq means National Association of Dealers Automated Quotations – the old school label for over-the-counter computerized dealer-access trading screens.) – and there’s the Nasdaq 100 (NDX), which in ETF land is the Qs, or “QQQ.” The NDX is comprised of the 100 largest market cap Nasdaq-listed companies that are not financials.