
Income On Demand: How to Target Today’s Top Yielding Stocks (and More) for FREE

Imagine if you could press a button and instantly generate a list of the market’s highest-yielding income stocks.
Or find out which tiny tech company – out of hundreds of tiny tech companies – is on its way to becoming the next Netflix (Nasdaq: NFLX).
What if you could access a current list of Wall Street’s best value plays… on demand… at any time of day?
You can.
And best of all… it won’t cost you a dime.
Thanks to modern technology – and easy-to-use sites like Finviz and TradingView – you can build custom screens that allow you to do everything we mentioned above.
You can select and sort stocks based on a wide variety of metrics, such as…
- Industry
- Market cap
- Sales and revenue trends
- Price-to-earnings (P/E) ratio
- Dividend yield
- Cash flow
- And more.
When you combine metrics in different ways, it allows you to get a sense of where a stock – or group of stocks – is heading.
That information can be incredibly useful… and profitable.
Let us show you how to get started.
Picking the Right Tool for the Job
To kick things off, you need to first settle on a screening tool.
Finviz is good for beginners. It’s free and simple to operate. But there are plenty of other options – both free and paid, with varying degrees of complexity – you can choose from.
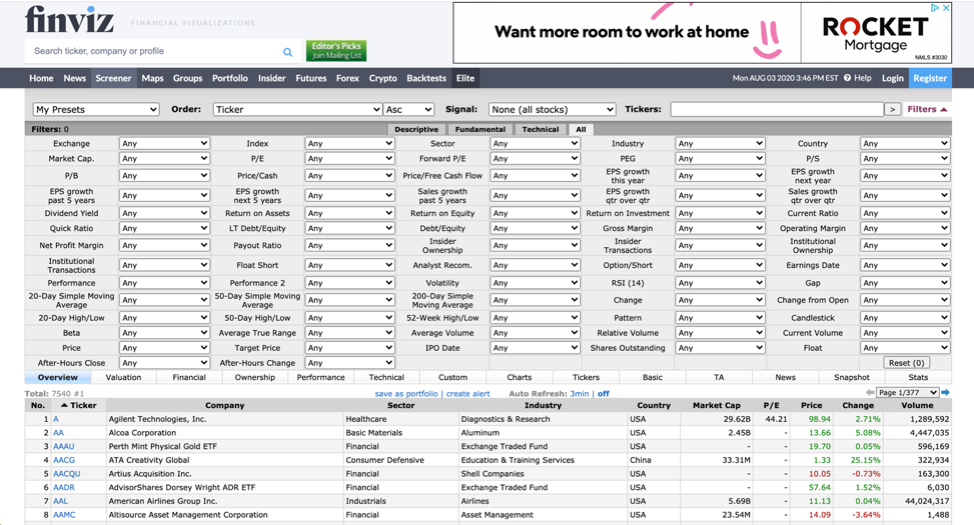
Screenshot of Finviz screener tool
TradingView, which we previously mentioned, allows you to build custom screens for free. But you can’t export your data, and certain chart types are restricted unless you upgrade.
However, if you’re a TD Ameritrade account holder, you can access its premium screening tools without paying any additional fees.
A quick online search will pull up services by Zacks, ChartMill, Stock Rover and countless others. So to sum up… there’s no shortage of screeners for you to choose from.
A word of advice: If you’re new to these types of platforms, test out one of the freebies – like Finviz – first. You can always pony up for a premium account later, once you’ve got a good grip on how everything works.
And as soon as you’ve settled on a screening tool, the real fun can begin.
It’s time to create your first screen.
Screener No. 1: Gunning for Growth… in Wall Street’s Hottest Sector
Ask the average investor what they’re looking for in a stock and they’ll say one word: growth.
Companies that consistently expand their business and sales each quarter are some of the best stocks to own. See: Apple (Nasdaq: AAPL).
And if you’re looking for growth, you’d better be looking at tech.
Not only is it a red-hot sector… but it’s also a breeding ground for some of the most reliable growth stocks on the market right now.
Here’s what our tech growth screen looks like:
- Sector: Technology
- Year-Over-Year Quarterly Revenue Growth: > 25%
- Year-Over-Year Growth in Earnings per Share (EPS): > 20%
- Market Cap: > $20 billion
As you can see, we’re focusing on high year-over-year quarterly revenue growth to ensure that we’re not investing in some flash-in-the-pan play. We want to filter out companies that had a one-time profit surge because of an accounting anomaly.
EPS growth ensures that a decent portion of the sales boom is flowing to the companies’ bottom lines.
And lastly, we go with a minimum market cap of $20 billion to weed out small, risky players.
Plug these metrics into your screener and it’ll let you know who the top players in Wall Street’s most explosive sector are.
Screener No. 2: Uncover the Market’s Greatest Value Plays
Buy-and-hold investors love a good value play. These plays are a cornerstone of any solid, long-term portfolio.
And who doesn’t love a good deal?
Essentially, what we’re looking for with our value screener are companies that are fundamentally sound and trading at a discount compared with their peers.
The recipe is simple. Here’s what you’ll enter into your screening tool:
- Trailing P/E Ratio:< 20
- Price-to-Earnings to Growth (PEG) Ratio:< 1
- Return on Equity: > 15%
- Market Cap: > $10 billion
A trailing price-to-earnings ratio below 20 will give us stocks below the S&P’s current valuation of 22.
The PEG ratio ensures the companies we find aren’t cheap merely because growth is stalling and Wall Street expects smaller earnings.
A return on equity above 15% gives us stocks that are doing good, fundamental business and using their assets efficiently.
And the $10 billion market cap weeds out any volatile small companies.
Easy enough, right? This is the screener to fire up when you’re looking for high-quality bargain buys.
Screener No. 3: Want to Stay Paid? Give This a Try
Our final stock screen is sure to please anyone searching for rock-solid income yields.
It can be tough to find stocks that pay solid – and rising – dividends. And even if you do find a good candidate, there’s no guarantee that share prices will see the same healthy growth…
Or that the company will remain strong enough to support that dividend in the future.
That’s where this handy screen comes in:
- Dividend Yield: > 3%
- Year-Over-Year Change in Cash Flow Growth: > 10%
- Year-Over-Year Growth in EPS: > 20%
- Market Cap: > $50 billion
Obviously, we want to target dividend-paying stocks with a yield of at least 3%. It’s a solid base figure… and realistic.
Beyond that, as you can see, we’re focusing tightly on cash flow and earnings.
Cash flow growth helps to ensure the dividend can be paid out again next year and has a chance of growing.
EPS growth does the same thing, but also helps get us into growth companies that have a strong shot of share price appreciation.
And once again, we’re keeping our desired market cap at a respectable amount. Remember, we’re looking for solid, proven companies that can keep us profiting for a long, long time.
Try plugging this screen – and the others above – into a screening tool today. And when you start to feel confident, start adding in your own qualifiers.
Knowing how to comb the markets for the hottest growth, value and income plays is a skill every investor should have.
Note: We’ve found that readers tend to buy the stocks in these special reports at different times. Keep in mind that we may have taken profits or stopped out of a recommendation by the time you read this report. Please refer to the current portfolios for the most up-to-date recommendations.
© 2026 Manward Press | All Rights Reserved
Nothing published by Manward Press should be considered personalized investment advice. Although our employees may answer your general customer service questions, they are not licensed under securities laws to address your particular investment situation. No communication by our employees to you should be deemed as personalized investment advice. We allow the editors of our publications to recommend securities that they own themselves. However, our policy prohibits editors from exiting a personal trade while the recommendation to subscribers is open. In no circumstance may an editor sell a security before subscribers have a fair opportunity to exit. The length of time an editor must wait after subscribers have been advised to exit a play depends on the type of publication. All other employees and agents must wait 24 hours after publication before trading on a recommendation.
Any investments recommended by Manward Press should be made only after consulting with your investment advisor and only after reviewing the prospectus or financial statements of the company.
Protected by copyright laws of the United States and international treaties. The information found on this website may only be used pursuant to the membership or subscription agreement and any reproduction, copying or redistribution (electronic or otherwise, including on the world wide web), in whole or in part, is strictly prohibited without the express written permission of Manward Press, 14 West Mount Vernon Place, Baltimore, MD 21201.
August 2021.