Dow 100,000? This Chart Says So
Andy Snyder|June 3, 2020

This is an absolutely tremendous time to be an investor.
At the threat of being hyperbolic, it may be the best time ever.
Across all three of the model portfolios we run, there are currently 22 open positions. All but two are worth more than we paid for them… many are worth significantly more.
We’ve got multiple stocks up by 20%, 30% and 40% just in the past few weeks. And we’ve got options surging by 100%, 200% and even 300%.
One of the companies we recently detailed in a special report to subscribers surged as much as 1,000% since January.
Times aren’t just good… They’re historic.
But as we’ve said many times over the last few weeks, this is just the beginning. You’re witnessing the birth of a contrived bull market that requires us to toss out everything we were taught.
The textbooks… the formulas… the assumptions… They’re gone.
There’s no need for them in a world where money isn’t just free, but where they’re actually stuffing cash into American mailboxes.
We’ve written you about Washington’s drunken spending and the Fed’s massive printing efforts. As trillions of brand-new dollars flow into the economy, they must go somewhere.
These days, that cash is flowing to the stock market.
Why?
It ties straight to that notion that we believe every graduating senior should be forced to recite before he gets his diploma… “Money goes where money is treated best.”
An Upside-Down World
It’s no secret that interest rates have been on the decline for nearly 40 years. And now that the Federal Reserve has cut them to zero twice in the last 12 years, all that’s left for the money maestros to do is tour the country and tell investors that rates are not coming back… at least not in our lifetimes.
Since March, Jay Powell has embarked on a publicity tour that would make even the most aggressive campaign manager jealous. Just this week, the Fed chief joined the folks at Princeton to share an important message with his cronies.
There’s no end in sight, he told them.
Powell seemed proud to boast that his group of bankers “crossed a lot of red lines that had not been crossed before.” And now that they’re past them… they’ll keep on walking.
Long term, as you know, it’s bad news – terrible news, really.
Short term, though, it’s painfully clear that it’s time to buy like hell. As the Fed holds its gun to the head of the free market, stocks have but one choice… nervously climb higher and higher.
To show you why we’re so convinced of the idea, we’ll show you a chart provided by a former Fed insider and unique thinker, Dr. Ed Yardeni.
He’s the man who coined the idea of the “Fed model,” the term for a simple yet quite controversial metric that allows us to compare the stock market with benchmark interest rates.
We like the idea because it flips everything on its head. It’s not the price-to-earnings ratio the model tells us to follow. It’s the inverse… the earnings to price.
Done this way, we get a sort of earnings yield for the stock market. Just like the yield on a bond, it tells us how much payback we’ll get for each dollar we spend.
In fact, Yardeni and other fans of the model argue that when the one-year forward-looking earnings yield equals the rate of the 10-year Treasury, stocks are fairly valued.
The only problem – or is it a massive opportunity? – is that the two numbers haven’t been in equilibrium since, oh, say, when the Fed slashed interest rates to then-record-low territory after the dot-com crash.
This chart should make you drool…
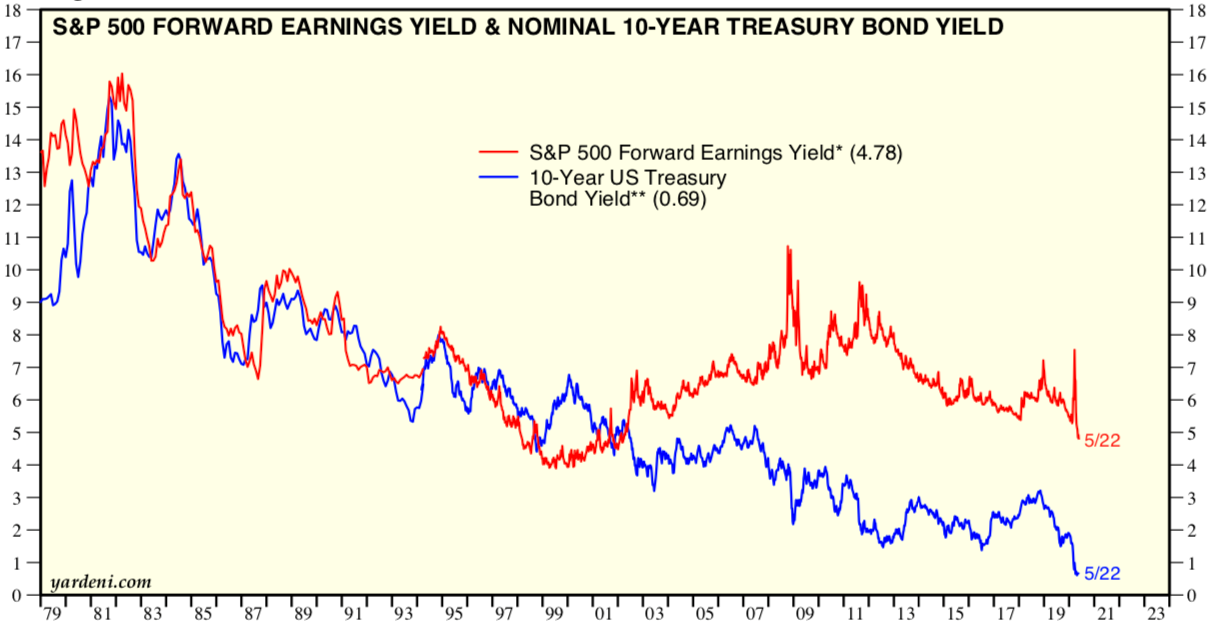 You can see for the better part of two decades (and even longer if we expanded the chart), rates and the market’s earnings yield walked hand in hand. But then the Fed stirred one bubble after the next and pushed rates lower and lower and lower… until they’ve all but disappeared.
Stocks, though, have not done what the chart tells us to expect. Oh sure, they’ve climbed quite a wall of worry over the last decade – tripling in value while the economy remained stagnant.
But by the figures above, stock prices (the denominator in our equation) would have to rise tremendously to bring things back into equilibrium.
Yielding $4.78 worth of earnings for every $100 invested, stocks are far more valuable than the mere $0.69 coming from 10-year Treasurys these days.
It’s a tremendous gap.
To close it, rates have to rise, earnings must fall or stock prices have to soar.
The first two don’t seem likely – not with so much free money being tossed around. That leaves only the third option… and the idea that equilibrium would require a massive surge in stock market values.
This controversial equation calls for a 624% move… a bit ambitious, we admit.
But half that? Dow 100,000?
Wait and see.
We live in strange times. It’s time to bite your lip and buy like hell.
P.S. We just released the name of one of our favorite stocks of 2020… and we’re giving away the ticker symbol for free. If you’re looking for an easy, low-risk way to put our theory to the test… this is it.
Like what you’re reading? Let us know your thoughts here.