The Simple Trick That Made This Subscriber $100,000 in a Month
Andy Snyder|December 16, 2020

Here’s a trick that could help you become a much better investor.
It helps answer the question that’s on the minds of many folks these days.
As the market hits fresh highs… as good stocks get even better… how do we know a good time to get in?
The answer is in the charts.
For proof… take a look at this note we just received from a subscriber to our Codebreaker Profits research service.
Pay particular attention to the last line.
Andy, this is the first time that I have ever sent an email to a financial publisher or editor. I am a lifetime subscriber to Codebreaker Profits. I hit $100,000+ in net profits this month from your Codebreaker recommendations after the WDR calls exploded for 400%+ gains. I had accumulated over 100 call contracts as option values dropped below $0.80 and I sold all contracts for a net profit of $69,710.
What a win!! Thanks for all you do. – Customer for life R.S.
What a great note.
Of course, I don’t know how much R.S. started with… but judging by his excitement, $100,000 in a month is an accomplishment of a lifetime.
We’re not taking credit, though. All we did is point him to the right stock at the right time.
The smart investor did the rest. Again, the answer lies in that last line. He bought more contracts when they dipped below $0.80.
He set his price and stuck to it – buying only when the price was right.
But how do we know the right price?
Ah… this is where a bit of simple charting technology comes in. It’s the backbone of our Codebreaker Profits system.
A Tale of Two Charts
We use something we call K.I. Channels to chart a stock’s movement.
You see, you could look at a standard stock chart (courtesy of StockCharts) and see this…
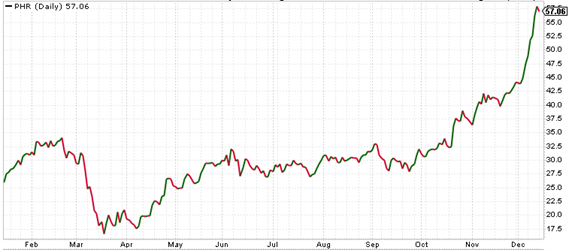 Or you can add just a bit of charting power to it – including our absolute favorite indicator, volume – and see this…
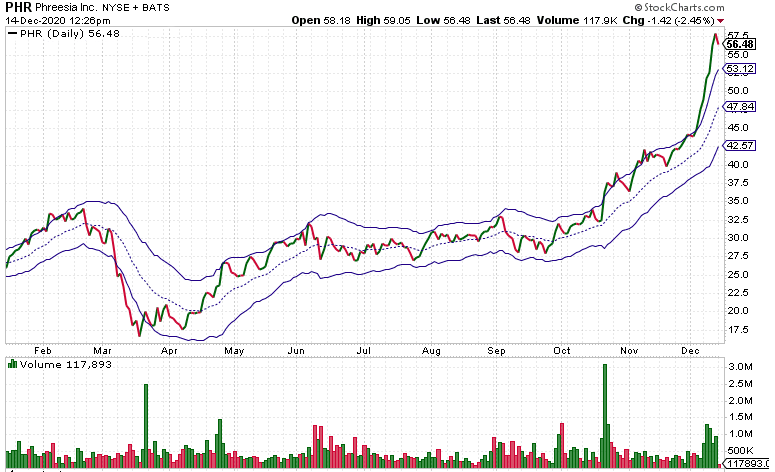 When it comes to helping us pinpoint an ideal entry point, the two charts paint vastly different pictures.
In fact, we just used that second chart to lock in a 300% option gain that exemplifies our “buy smart” strategy.
Let’s walk through it…
Reading the Tape
We bought our stake in Phreesia (PHR) – a health IT firm – on October 30.
Here’s how we summarized things for our Codebreaker readers:
It’s a classic K.I. buy signal. After a strong volume spike in mid-October, shares climbed above their upper K.I. band and have now settled just below it, confirming long-term strength.
Like so many good trades, this one started off after we picked up on the huge volume spike. It was a surefire sign that somebody – or lots of somebodies – was bullish on the stock.
But when to get in?
Do we buy when the volume is spiking and risk buying at the top?
Or do we wait for a dip that may never come?
Surely you’ve wrestled with these questions.
Answering them is where the K.I. Channels shine. Thanks to a couple of simple lines, we can see that huge volume spike pushed shares outside their normal trading range. Experience tells us it’s the start of a strong bull run… but it also tells us shares will likely revert to their mean after crossing the barrier.
They almost always dip before climbing again.
That’s when the savvy investor (like R.S. above) buys – on that short-term dip. It greatly puts the odds of a successful trade in his favor.
If his thesis is right and the volume spike was the precursor to a huge run higher, the buyer gets in for a few bucks less.
And if he’s wrong or the broader market heads south, then he’s not holding a stock that he bought near its highs.
It’s always much better to buy a good stock when it’s in the middle of its trading range.
The note from R.S. above proves it.
It takes just two super-simple indicators to get the job done… volume and K.I. Channels.
Sadly, most folks overlook them.
As markets stretch into record-high territory, adding this simple buy indicator to your strategy could quickly amplify your gains and reduce your risk.
Try it.
And if you want to see the supercharged power of volume… and what a once-a-month trading technique can do for your wealth, click here.
Our next trade comes on Thursday!